

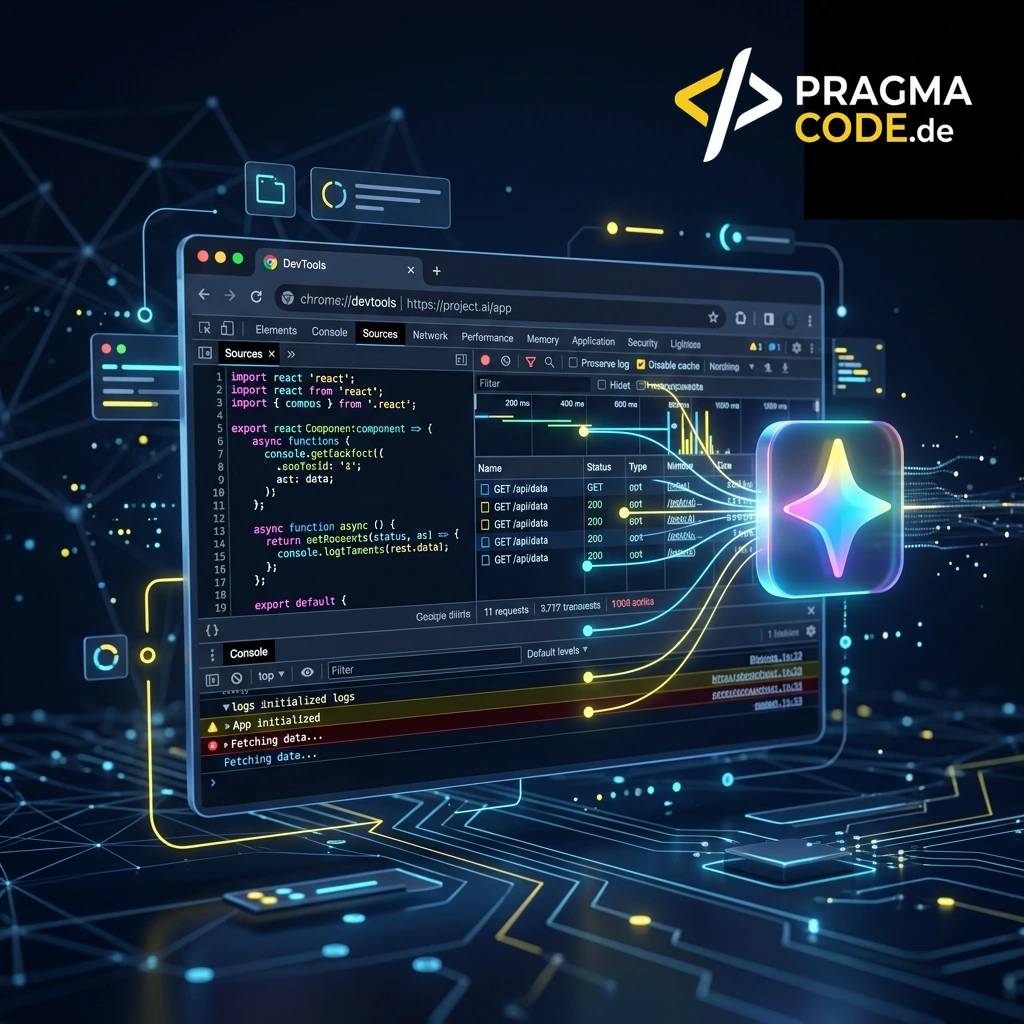
In 2026, Google Gemini fundamentally transforms in-browser debugging: From AI-assisted CSS cascade diagnostics and automated console insights to Core Web Vitals profiling and the native Chrome DevTools MCP server for autonomous coding agents. Discover how modern development teams slash troubleshooting cycles and future-proof their web architectures.
This article is an in-depth expert contribution from our content cluster. Discover the complete overview on our main page: Web Development & Modern Web Architecture →
The End of Manual StackOverflow Searches
The integration of LLMs directly into browser developer tools marks a fundamental turning point. In 2026, debugging is no longer a lonely guessing game over cryptic error messages, but an interactive dialogue with an assistant that understands the complete runtime context of your website.
- Context-Aware Debugging: Gemini reads DOM structures, CSS rules, network payloads, and call stacks in real-time to deliver precise diagnoses instead of generic advice.
- Performance Breakthroughs: Instead of manually decoding complex CPU and memory profiles, the AI analyzes bottlenecks like Layout Shifts (CLS) or long execution times (INP) and suggests concrete refactoring code.
- The Path to the Agentic Web (WebMCP): Through the Model Context Protocol for the Web, developers prepare their sites for autonomous AI agents by exposing structured interfaces directly in the browser and auditing them via DevTools MCP.
- 1. Introduction: The Evolution of Debugging
- 2. Elements Panel: Mastering CSS & Layouts
- 3. Console Insights: Resolving App Errors
- 4. Sources Panel: Understanding Code Logic
- 5. Network Panel: API Requests & CORS Obstacles
- 6. Performance Profiling: Optimizing Web Vitals
- 7. The Future: DevTools MCP and Autonomous Agents
- 8. Setup Guide: Activating AI in DevTools
- 9. Conclusion: The Developer as Conductor
1. Introduction: The Evolution of Debugging in the AI Era
Since the early days of web development, finding and resolving bugs has been one of the most time-consuming tasks in a developer's daily routine. Who doesn't remember the times when a simple alert() was the only way to inspect the state of an application? The introduction of modern browser developer tools – particularly the Chrome DevTools – changed this fundamentally. We gained DOM inspectors, JavaScript debuggers, network monitors, and highly sophisticated performance profilers.
Yet, despite all these powerful tools, a core problem remained: the tools provided us with raw data, but interpreting that data and finding the actual root cause of an error was still entirely up to the human developer. When faced with a cryptic JavaScript error or a complex CSS Flexbox layout that wouldn't align, the classic odyssey began: copy the error message, search Google, read StackOverflow threads, try out code changes, fail, and start over.
In 2026, this frustrating workflow is a thing of the past. With the deep integration of artificial intelligence into the Chrome browser and the introduction of the AI Assistant in Chrome DevTools (powered by Google Gemini), we are experiencing a true revolution. The browser no longer just outputs cold metrics; it actively understands the context of the executed code and acts as an intelligent pair-programming partner right where the action is.
At Pragma-Code, we leverage these pioneering AI tools daily to build faster, safer, and more performant web projects for SMEs. In this in-depth guide, we show you how to unlock the full power of the Chrome DevTools AI Assistant and elevate your development workflow to a whole new level.
2. Elements Panel: Mastering CSS and Layouts with AI Assistance
The Elements panel is the hub for all visual adjustments. This is where frontend developers spend hours fine-tuning CSS rules, tweaking box model properties, and correcting layout glitches. However, CSS is famous for how small edits can have cascading, unexpected side effects on other components. A misaligned element, a disappearing scrollbar, or a broken grid layout can drive even experienced developers crazy.
The AI Assistant (DevTools) brings clarity to the styling chaos. When you select an element in the DOM tree and click the sparkle icon (AI Assistance) in the Styles tab, the AI analyzes not just the rules directly applied to the element, but the entire inherited context of the parent and child elements. It doesn't just ask "Which CSS classes are active?", but understands "Why is this element behaving visually the way it is?".
Comparison: Visual Debugging
- Manual Troubleshooting: Digging through hundreds of inherited and overridden CSS rules.
- Treating Symptoms: Experimentally throwing in
!importantor arbitrary paddings. - Trial & Error: Constantly reloading and resizing viewports without any guarantee of success.
- Direct Root Cause Analysis: The AI immediately explains which rule blocks the layout (e.g., collision of
flex-basisandwidth). - Refactoring Proposals: Generation of clean, modern CSS (e.g., Grid instead of legacy floats).
- Responsive Preview: Simulations of visual impacts across all screen sizes directly inside the explanation.
A classic real-world example: A developer wants to vertically center an element within a container using align-items: center, but the element remains stubbornly glued to the top. Instead of spending hours disabling CSS rules, they can ask the AI Assistant: "Why isn't my button vertically centered in this flex container?"
Within seconds, Gemini responds: "The element is not centered because the parent .flex-container has an implicit height of 0px, sized only by its content. Furthermore, the CSS rule align-self: flex-start on the button (line 42 of main.css) overrides the container's alignment. To fix this: 1. Remove align-self from the button. 2. Give the container a minimum height (e.g., min-height: 100px;)."
3. Console Insights: Understanding and Automatically Fixing App Errors
The JavaScript console is the primary window for application errors at runtime. But many errors, especially those originating from external libraries or complex frameworks like React, Next.js, or Angular, are often cryptically worded. A classic TypeError: Cannot read properties of undefined (reading 'map') tells you what went wrong, but rarely explains why or how to fix it cleanly.
This is where Console Insights steps in. Next to every console error, a small button appears: "Understand this error". Clicking it triggers a three-step analysis by the assistant:
Retrieve Code Context: The AI reads the corresponding stack trace and analyzes the exact source file at the failing location.
Explain Root Cause: The error is explained in plain language – including the logical chain of execution that led to the crash.
Generate Code Fix: A corrected code snippet is provided to catch or resolve the issue.
To avoid Astro template compilation issues, all code snippets inside the DevTools explanations are cleanly escaped. Here is an example of how the AI Assistant analyzes and resolves buggy code:
// BUGGY CODE (leads to TypeError)
const renderUserList = (data) => {
  return data.users.map(user => {
    return `<div class="user-card">${user.name}</div>`;
  });
};
If the passed data object lacks the users property (e.g., due to an API payload change), the app crashes. The AI Assistant immediately suggests a robust safeguard:
// OPTIMIZED CODE (Proposed by the AI Assistant)
const renderUserList = (data) => {
  // Optional Chaining and fallback value
  if (!data?.users) {
    console.warn("User data is missing or malformed:", data);
    return '<p>No users found.</p>';
  }

  return data.users.map(user => {
    return `<div class="user-card">${user.name ?? 'Unknown User'}</div>`;
  });
};
The benefit is clear: The developer doesn't need to switch contexts. They don't have to manually copy the source code to a separate LLM window; error analysis and fixes happen seamlessly within the debugging environment.
4. Sources Panel: Deciphering Code Logic and Algorithms
In the Sources panel, developers navigate the application's loaded files. On large projects or when onboarding to legacy code bases, one is often confronted with complex, uncommented algorithms. Reading becomes especially painful when code has been minified, transpiled, or obfuscated by build tools.
The Chrome DevTools AI Assistant acts as an interactive code explainer. You can highlight any function in the Sources panel, right-click, and select the option "Explain selected code". Gemini analyzes the syntax and logic of the highlighted block and outputs a structured breakdown of how it works.
Pro-Tip: Hunt Down Stale Closures
Use the AI in the Sources panel to hunt down subtle JavaScript bugs like stale closures in React hooks. Highlight the suspect block and ask: "Is there a risk of a stale closure in these asynchronous hook handlers?" The AI's static data flow analysis frequently catches these pitfalls much faster than manual reviews.
This is particularly useful when analyzing asynchronous JavaScript, nested promises, or complex RxJS observables. The AI breaks the code down into logical milestones and explains exactly when and how data is transformed. This saves valuable onboarding time and increases code quality across the team.
5. Network Panel: Diagnosing API Requests and CORS Obstacles
Modern web apps live on continuous data exchange with APIs and backend services. When a network request fails, the Network panel is the first line of defense. But HTTP status codes, headers, and JSON payloads can be overwhelming. In particular, CORS (Cross-Origin Resource Sharing) errors are among the most notorious headaches for web developers.
By selecting a failed request in the Network panel and passing it to the AI Assistant, the AI analyzes both request and response headers to determine why the transfer was blocked. A typical scenario is a missing or misconfigured Access-Control-Allow-Origin header on the API server.
The Problem
Your frontend app is running on https://www.pragma-code.de, but tries to fetch data from https://api.example.com without the server explicitly allowing it.
The Cause
The server responds without the header Access-Control-Allow-Origin: https://www.pragma-code.de.
The Solution
Exact configuration suggestions for popular server environments (Node.js/Express, Nginx, Apache, or Cloudflare Workers) to set the headers correctly on the backend.
6. Performance Profiling: Optimizing Core Web Vitals
Optimizing page load speeds and user interactions (measured via Core Web Vitals) is critical for SEO success and conversions. However, the Performance panel in DevTools is widely regarded as one of the most complex, intimidating tools available. The flood of flame charts, CPU load graphs, main thread activities, and memory usage lines can easily overwhelm developers.
The AI Assistant serves as your personal performance consultant. It reads the recorded performance profiles and translates raw flame charts into actionable recommendations.
Accelerating Largest Contentful Paint (LCP)
The AI identifies exactly which element (e.g., an unoptimized hero image) is delaying the LCP score. It suggests optimizations such as implementing fetchpriority="high" or switching to modern image formats like WebP/AVIF.
Optimizing Interaction to Next Paint (INP)
The AI analyzes blocking tasks (Long Tasks) on the main thread. It pinpoints slow event listeners and suggests offloading heavy operations to Web Workers or deferring them using requestIdleCallback.
Eliminating Cumulative Layout Shift (CLS)
The AI Assistant detects unstable DOM elements that jump during page loads. It immediately generates CSS rules for fixed aspect ratios or skeleton placeholders to prevent layout shifts entirely.
A typical performance optimization workflow with the assistant looks like this:
Record a Profile
Start a recording in the DevTools Performance tab while performing common user interactions on your website.
Highlight a Bottleneck
Select a red-marked indicator in the profile (such as a red bar denoting a Long Task that blocks the main thread).
Analyze with AI
Click "Analyze with AI". Gemini reads the call stack and explains in plain English which JavaScript function caused the latency.
Implement the Fix
Deploy the optimized code suggested by the AI (e.g., debouncing scroll handlers) and verify the improvements in a new profiling run.
7. The Future: DevTools MCP and Autonomous Web Agents
As we look beyond 2026, it is clear that how we use the web is shifting fundamentally. We are moving away from a "human-only" web toward a hybrid environment where autonomous AI agents purchase products, make bookings, and aggregate information on behalf of users.
In our in-depth article on Google's Agentic Browsing, we analyzed this trend in detail. A key standard driving this transition is the Model Context Protocol (MCP) and its web extension WebMCP. What does this mean specifically for Chrome DevTools?
DevTools in 2026 is evolving into an essential bridge between developer IDEs and autonomous browser agents:
1. The Official Chrome DevTools MCP Server (chrome-devtools-mcp): Developers no longer inspect pages exclusively inside interactive browser tabs. Through standardized JSON-RPC interfaces exposed by the DevTools MCP server, external coding agents (in Claude Code, Cursor, or Antigravity) can connect directly to active browser sessions. An IDE agent can take DOM snapshots, evaluate CSS styles dynamically, inspect failed network requests, and trigger automated Lighthouse audits – all without requiring manual clicking by the developer.
2. Standardized Accessibility Tree (Chrome 148+): Because autonomous agents parse interfaces primarily through semantic trees rather than raw visual pixels, DevTools has upgraded the full accessibility tree into a primary inspection surface. Developers can verify that interactive controls offer well-formed roles, accessible names, and valid ARIA states – a crucial requirement both for statutory accessibility compliance and for reliable agentic browsing.
3. Live WebMCP Validation: Developers use the built-in Chrome AI Assistant as a live proxy for user agents. You can prompt the assistant to: "Fill out this multi-step form with dummy data and verify that validation errors are returned correctly", ensuring that your declared WebMCP tool schemas and endpoint contracts work reliably for automated agents.
The Cost Trap: Barriers for Web Agents
Websites that rely solely on styling without semantic structures or standardized WebMCP APIs effectively shut out search agents. This leads to a severe drop in visibility in generative search systems (GEO). With DevTools, this AI readability can be systematically tested and optimized.
8. Setup Guide: Activating AI Features in Chrome
AI assistance features are built into current Chrome versions, but they may need to be enabled in settings. Follow this step-by-step timeline to activate them:
Ensure you have the latest version of Google Chrome installed (check under chrome://settings/help).
Sign in to the browser with your Google Account. Some advanced developer features require a developer profile.
Open Developer Tools (F12 or Right-Click → Inspect). Click the gear icon (Settings) in the top-right corner of DevTools.
Navigate to "AI Innovations" in settings and check the options for "Console Insights", "AI assistance panel", and "CSS explanations".
Quick-Check: Getting Started with AI-Powered Web Debugging
9. Conclusion: The Developer as Conductor
The integration of the Chrome DevTools AI Assistant is far more than a nice utility – it marks a transition into a new era of software development. The days when developers spent hours deciphering cryptic error messages, tracing CSS cascading bugs, or interpreting complex performance flame charts are ending.
By embedding Gemini directly into the browser's runtime context, a highly potent synergy is born. The assistant doesn't supply generic answers from a static training set; it analyzes the living, active runtime state of your web page. It acts as an intelligent partner that proposes fixes, isolates bugs, and recommends best practices.
This doesn't make developers obsolete. On the contrary, your role is shifting. Developers are transforming from manual bug-hunters into conductors of complex, intelligent systems. You focus on architecture, UX, and strategic feature implementation, while the AI takes care of the repetitive debugging details.
Are you looking to modernize your web infrastructure, optimize web application performance, or prepare your platform for autonomous web agents? The team at Pragma-Code is ready to help you with forward-thinking IT consulting, modern web development, and custom AI automations. Contact us for a free initial consultation and let's shape the future of your digital systems together.
Do you have questions about the Chrome DevTools AI Assistant?
Schedule a Free Strategy CallOur Regional Expertise
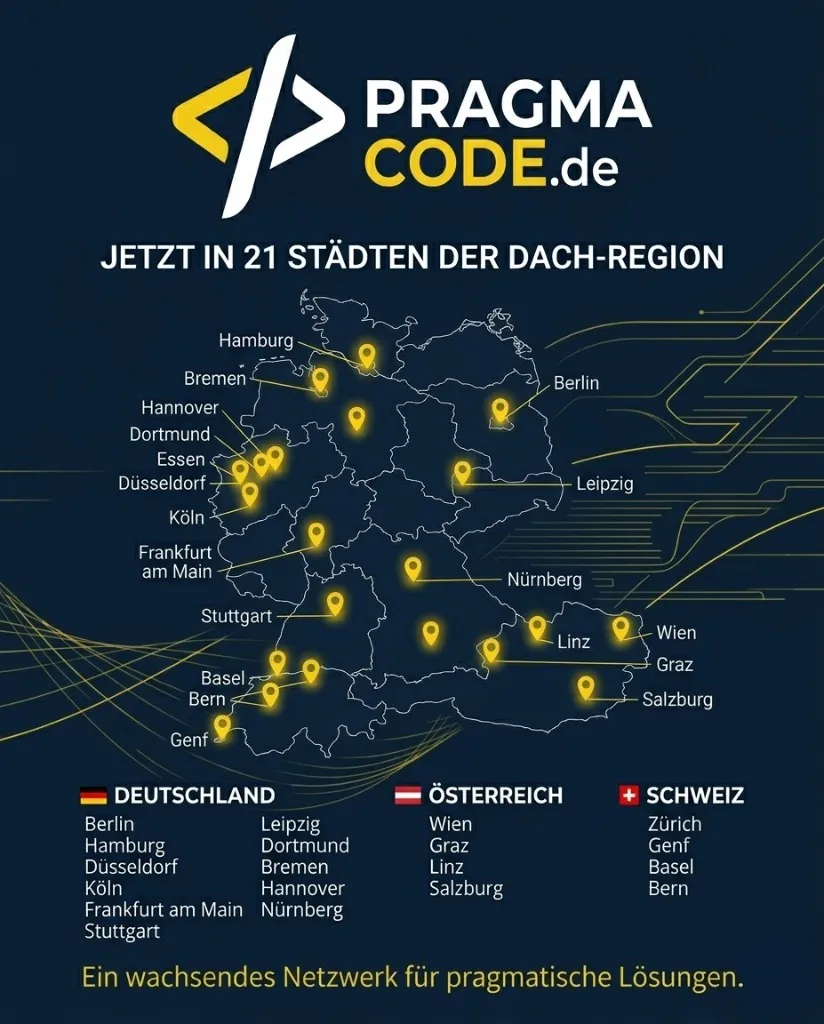
We are your digital partner – regionally anchored and successfully scaling across borders.
Have a vision?
Let's check together how we can make your idea take flight.
Book your free strategy call nowExtended Specialized Glossary
Chrome DevTools
The built-in suite of web developer tools inside Google Chrome that allows developers to inspect, debug, and optimize HTML, CSS, and JavaScript in real-time.
AI Assistant (DevTools)
A Gemini-powered panel within Chrome Developer Tools that assists developers with context-aware troubleshooting of CSS styling bugs, explaining console errors, and optimizing web performance.
Model Context Protocol (MCP)
An open standard protocol introduced by Anthropic that provides a uniform way for AI models to securely connect to external tools, data repositories, and APIs.
WebMCP
A proposed standard for registering and validating web-based tools for AI agents, allowing websites to expose interactive forms and functions directly to machines.