

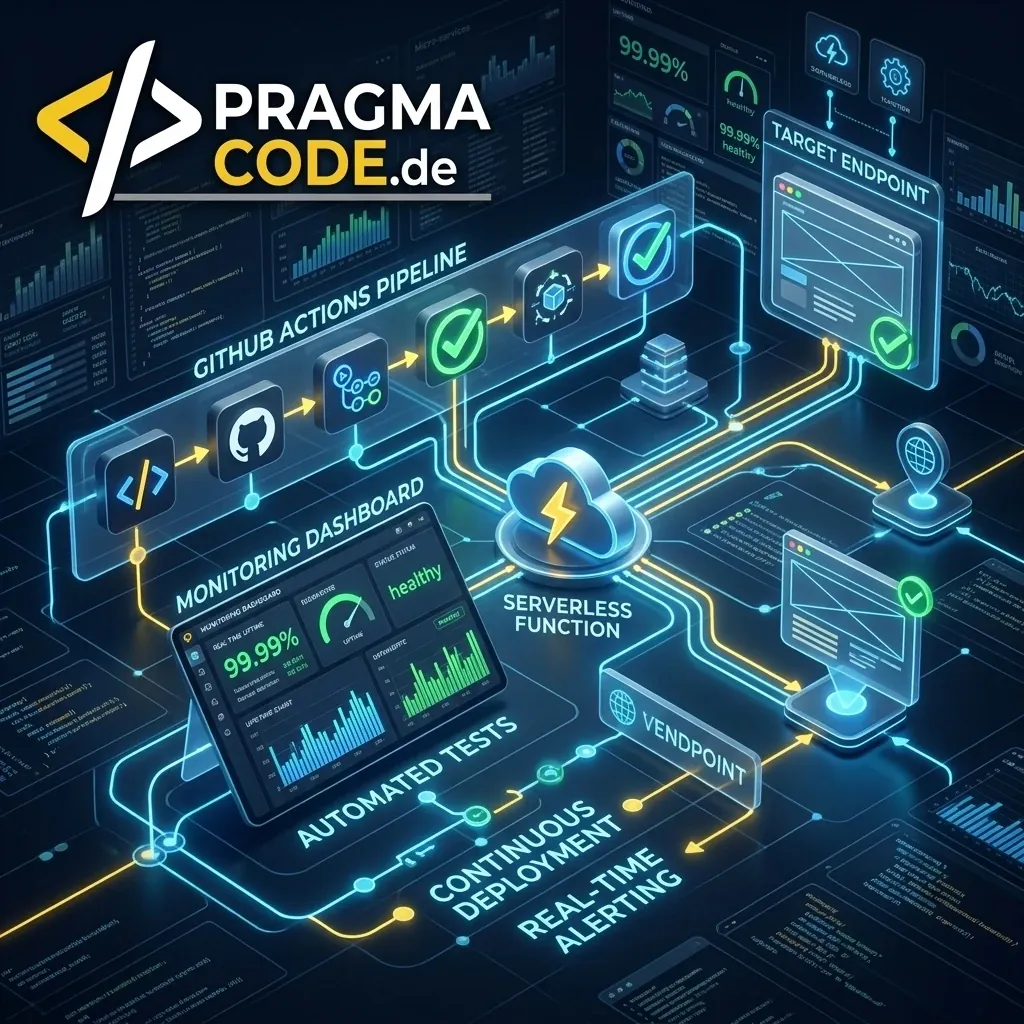
Discover how to eliminate rigid SaaS subscriptions and build a resilient, serverless monitoring infrastructure as code using GitHub Actions and Playwright – covering functional E2E form tests, performance budgets, and AI crawlability audits.
This article is an in-depth expert contribution from our content cluster. Discover the complete overview on our main page:AI & Automation Solutions →
The Essential Foundation for GEO and Autonomous AI Agents
In the era of Agentic AI, Generative Engine Optimization (GEO), and autonomous web agents, 100% reliable uptime and flawless user flow execution are mandatory. When crawlers from Perplexity, SearchGPT, or Google AI Overviews encounter unhandled JavaScript errors, broken APIs, or failing structured data, your brand is instantly de-indexed from synthesis responses. Serverless Synthetic Monitoring proactively protects your digital visibility.
- Reduce SaaS Tool Costs to $0: Leverage GitHub Actions' 2,000 free runner minutes per month to run enterprise-grade synthetic monitoring without recurring third-party subscriptions.
- True Functional End-to-End Testing: Using Microsoft Playwright, test complete real-world journeys—such as multi-step lead forms, cookie banner bypasses, and checkout funnels—in real headless browsers rather than relying on simple ping checks.
- Monitoring-as-Code & Multi-Channel Alerting: Version all test scripts directly in your Git repository. On test failure, receive rich instant alerts via IONOS SMTP, Slack, MS Teams, or Telegram complete with full-page screenshots and execution traces.
- 1. The Hidden Threat: Why HTTP 200 OK is Deceptive
- 2. The Subscription Cost Trap of Traditional SaaS Monitoring
- 3. The Principle of "Monitoring-as-Code" with GitHub Actions
- 4. Playwright in Action: Multi-Step Forms, Checkouts & Shadow-DOM
- 5. Performance Budgets & Core Web Vitals (LCP, INP, CLS) in CI
- 6. AI & Bot Readiness: Monitoring for SearchGPT, Perplexity & llms.txt
- 7. Comparison: Traditional SaaS vs. Serverless GitHub Monitoring
- 8. The Pipeline Lifecycle: From Cron Trigger to Incident Alert
- 9. Step-by-Step: YAML Workflow & Caching Optimization
- 10. Security Governance, Zero-Trust Secrets & OIDC
- 11. Enterprise Best Practices for Flake-Free Test Suites
- 12. 5-Stage Rollout Roadmap for Your Monitoring Platform
- 13. Conclusion: Data Sovereignty & Cost Advantage Through Code
- 14. Specialized Industry Glossary
1. The Hidden Threat: Why HTTP 200 OK is Deceptive
Many organizations operate under a false sense of digital security: "Our website was recently rebuilt and the hosting server is healthy—what could possibly go wrong?" However, modern web architectures with Single Page Applications (SPAs), complex JavaScript hydrations, third-party integrations, and dynamic micro-frontends face an insidious risk: the Silent Failure.
A silent failure occurs when the underlying web server responds with a flawless HTTP 200 OK status, while the user interface in the client's browser is completely broken. Typical triggers include:
Unhandled Runtime Exceptions
An automated third-party tag manager or consent banner update throws an Uncaught TypeError, completely halting DOM rendering.
Altered API & Payload Schemas
CRM or email marketing endpoints change payload structures unexpectedly, causing contact form submissions to fail silently.
Erroneous CAPTCHA & WAF Blocks
Anti-bot systems falsely flag legitimate user submissions as bot traffic without generating any server-side error logs.
Conventional uptime checkers that only send periodic HTTP GET pings every 5 minutes cannot detect these functional breakdowns. Marketing and sales teams only discover the outage weeks later—after noting a sharp, unexplained decline in inbound leads and revenue. This is where Synthetic Monitoring provides true resilience: by executing actual user workflows inside real headless browsers at scheduled intervals.
2. The Subscription Cost Trap of Traditional SaaS Monitoring
When evaluating synthetic monitoring solutions, companies frequently choose commercial APM platforms such as Datadog Synthetics, Pingdom, New Relic, or Dynatrace. While convenient initially, these tools quickly turn into a significant financial and operational burden:
Ballooning Subscription Fees
Simple ping checks appear inexpensive, but once you configure browser-driven synthetics, 1-minute intervals, or multi-step checkout journeys across several domains, costs quickly surge to $150–$600+ per month.
Proprietary Vendor Lock-in
Test assertions are trapped inside proprietary SaaS editors. Migrating to another vendor or running tests locally within a developer's environment requires rebuilding all test cases from scratch.
Limited Customizability
Custom audits—such as querying Google Search Console APIs, validating Edge Worker routing, or inspecting llms.txt endpoints—are nearly impossible with rigid SaaS dashboards.
3. The Principle of "Monitoring-as-Code" with GitHub Actions
The modern, developer-centric alternative to proprietary SaaS silos is Monitoring-as-Code, implemented via GitHub Actions. GitHub Actions is the premier platform for Continuous Integration (CI/CD), offering virtual Linux, Windows, and macOS compute environments directly within your repository.
Instead of clicking through external dashboards, monitoring scripts are written in standard TypeScript or JavaScript and tracked in Git. You immediately benefit from identical engineering standards used across production applications: peer-reviewed Pull Requests, automated linting, branching workflows, and clear version history.
GitHub provides 2,000 free runner minutes per month for private repositories—and unlimited minutes for public repos. Because a well-tuned Playwright execution run takes merely 10 to 25 seconds of compute time, organizations can monitor dozens of websites every 15 to 30 minutes with zero hosting or licensing overhead.
Uptime & Latency (TTFB)
High-frequency HTTP/3 and cURL audits executed every 5 minutes verify global DNS resolution, SSL validity, and Time to First Byte to detect server degradation.
Functional E2E Flows
Real browser instances execute multi-step lead forms, authentication sessions, search filters, and checkout funnels with dynamic DOM assertions.
Core Web Vitals & Speed
Automated Lighthouse CLI audits monitor LCP, INP, and CLS across mobile and desktop viewports, alerting teams when Performance Budgets are violated.
AI & GEO Bot Readiness
Crawler verification for SearchGPT, Perplexity, and Claude: Audits llms.txt, Schema.org JSON-LD, and WAF rules to prevent unintended blocking of AI agents.
4. Playwright in Action: Multi-Step Forms, Checkouts & Shadow-DOM
To execute synthetic user validations, we utilize Playwright. Developed by Microsoft, this open-source framework is the recognized standard for E2E-Testing, controlling real Headless Browsers (Chromium, Firefox, and WebKit for Safari simulation) with native support for modern web APIs.
Compared to legacy frameworks like Selenium or Puppeteer, Playwright excels through Auto-Waiting: It automatically waits for elements to become visible, enabled, and stable before attempting actions. Flaky tests caused by transient network delays are completely eliminated.
Pro Tip: Anti-Spam Filtering for E2E Form Submissions
Always use a dedicated email pattern (e.g., synthetic-test+monitoring@yourdomain.com) and pass a hidden tracking header or parameter in automated form tests. Configure rules in your CRM or mail gateway (such as Postfix or Microsoft 365) to auto-archive these submissions, keeping your sales inbox clean.
The following TypeScript snippet demonstrates a resilient Playwright test that handles cookie banners, submits an inquiry form, and automatically captures full-page screenshots and DOM snapshots on failure:
import { test, expect } from '@playwright/test';

test.describe('Synthetic Website Monitoring', () => {
  test('Submit contact form & validate operational success', async ({ page }) => {
    // 1. Navigate with network idle assurance
    const response = await page.goto('https://www.pragma-code.de/en/contact', {
      waitUntil: 'domcontentloaded',
      timeout: 15000,
    });

    // Validate HTTP status
    expect(response?.status()).toBe(200);

    // 2. Defensively dismiss cookie banners if present
    const cookieAcceptBtn = page.getByRole('button', { name: /accept all|agree|allow/i });
    if (await cookieAcceptBtn.isVisible({ timeout: 2000 })) {
      await cookieAcceptBtn.click();
    }

    // 3. Populate form fields using accessible roles & labels
    await page.getByLabel(/Name/i).fill('Synthetic Monitoring Agent');
    await page.getByLabel(/Email/i).fill('synthetic-test+monitoring@pragma-code.de');
    await page.getByLabel(/Message/i).fill('Automated synthetic quality assurance test.');

    // 4. Submit the form
    const submitBtn = page.getByRole('button', { name: /submit inquiry|send message/i });
    await expect(submitBtn).toBeEnabled();
    await submitBtn.click();

    // 5. Verify success state (Thank you toast or redirection)
    const successToast = page.locator('.form-success-message, [data-testid="success-toast"]');
    await expect(successToast).toBeVisible({ timeout: 8000 });
  });
});
5. Performance Budgets & Core Web Vitals (LCP, INP, CLS) in CI
Page speed and user responsiveness directly determine conversion rates and organic search visibility. Google evaluates websites based on Core Web Vitals:
Largest Contentful Paint (LCP)
Measures perceived loading speed of the primary content element (Main hero or banner). Target: < 2.5 seconds.
Interaction to Next Paint (INP)
Assesses interface responsiveness to user inputs such as clicks or keypresses. Target: < 200 milliseconds.
Cumulative Layout Shift (CLS)
Measures visual stability and unexpected layout shifts during page rendering. Target: < 0.1.
Third-party analytics scripts, unoptimized media, or tag updates often introduce performance regressions over time. By executing the Lighthouse CLI inside scheduled GitHub Actions workflows, teams establish enforced Performance Budgets.
If a CMS update degrades LCP beyond 2.5 seconds or drops the overall performance score below 95, the workflow fails automatically and alerts engineers immediately—preventing search rank depreciation before it takes effect.
6. AI & Bot Readiness: Monitoring for SearchGPT, Perplexity & llms.txt
In 2026, search discovery is undergoing a major evolution: In addition to standard search engine crawlers, autonomous AI agents, SearchGPT, Perplexity Sonar, and Claude Search browse the live web to synthesize real-time answers.
To ensure your content is cited by these agents, your infrastructure must remain optimized and accessible (Agentic Browsing & GEO). Modern GitHub Actions monitoring actively validates:
Availability of /llms.txt & /llms-full.txt
Confirms that machine-readable AI documentation files return HTTP 200 OK without formatting errors.
Schema.org JSON-LD Integrity
Verifies that structured data entities (such as Organization, Article, FAQPage, or OfferCatalog) exist in the rendered DOM and match Schema specifications.
Cloudflare & WAF Rule Auditing
Ensures that bot protection features (e.g., Cloudflare Bot Fight Mode) do not inadvertently block verified AI crawlers with 403 Forbidden errors or captcha loops.
7. Comparison: Traditional SaaS vs. Serverless GitHub Monitoring
The direct comparison highlights why tech-forward companies and agencies are migrating away from proprietary SaaS monitors in favor of Git-integrated workflows:
Analysis: SaaS Tools vs. GitHub Serverless Monitoring
- Cost Model: High recurring monthly subscriptions ($150–$600+/month for multi-domain synthetics).
- Flexibility: Rigid, pre-configured check routines; custom API or DOM logic is tightly restricted.
- Data Privacy & GDPR: Data processed on US cloud instances requires complex DPAs and introduces compliance risks.
- Version Control: Configurations exist in separate web dashboards, disconnected from source code.
- Alerting: Generic email templates; SMS and custom webhook notifications frequently cost extra.
- Cost Model: $0 recurring costs via 2,000 free monthly GitHub runner minutes.
- Flexibility: Limitless customizability with native TypeScript, Node.js, and Python runtimes.
- Data Privacy & GDPR: Absolute data sovereignty; direct routing via European SMTP infrastructure (e.g. IONOS).
- Version Control: "Monitoring-as-Code" – all test logic is versioned directly in Git.
- Alerting: Native multi-channel alerts to Slack, MS Teams, Discord, Telegram & email.
8. The Pipeline Lifecycle: From Cron Trigger to Incident Alert
Because serverless synthetic monitoring requires no persistent background servers, environments are provisioned on demand and terminated immediately upon completion:
The GitHub Actions scheduler initiates the workflow according to your cron schedule (e.g., every 15 minutes for uptime or nightly at 02:00 UTC for deep E2E audits).
GitHub boots an isolated Ubuntu container, sets up Node.js, and retrieves cached Playwright browser binaries in seconds.
Playwright navigates target URLs, validates HTTP status codes, inputs test payloads, and asserts DOM states while monitoring latency.
If any assertion fails, Playwright automatically generates full-page screenshots, execution video recordings, and a complete trace archive.
The if: failure() step triggers: Formatted markdown alerts and screenshots dispatch via IONOS SMTP to admins and via webhooks to your Slack incident channel.
9. Step-by-Step: YAML Workflow & Caching Optimization
All orchestration logic is stored declaratively in .github/workflows/website-synthetic-monitoring.yml.
Pro Tip: Browser Caching Cuts Execution Time by 70%
Using actions/cache for Playwright's browser binary directory (~/.cache/ms-playwright) eliminates repetitive downloads on each run. This reduces workflow runtime from ~45 seconds to under 12 seconds, preserving up to 70% of your free runner minutes.
Below is the complete, production-ready GitHub Actions YAML workflow:
name: Synthetic Website Monitoring

on:
  schedule:
    # Run every 30 minutes (UTC)
    - cron: '*/30 * * * *'
  workflow_dispatch: # Allows manual trigger from GitHub UI

jobs:
  run-synthetic-monitor:
    name: E2E Playwright & Uptime Audit
    runs-on: ubuntu-latest
    timeout-minutes: 5

    steps:
      - name: 📥 Checkout Code
        uses: actions/checkout@v4

      - name: ⚙️ Setup Node.js 20
        uses: actions/setup-node@v4
        with:
          node-version: 20
          cache: 'npm'

      - name: 📦 Install Dependencies
        run: npm ci

      - name: ⚡ Retrieve Playwright Browser Cache
        id: playwright-cache
        uses: actions/cache@v4
        with:
          path: ~/.cache/ms-playwright
          key: ${{ runner.os }}-playwright-${{ hashFiles('**/package-lock.json') }}

      - name: 🌐 Install Chromium (if cache missed)
        if: steps.playwright-cache.outputs.cache-hit != 'true'
        run: npx playwright install --with-deps chromium

      - name: 🚀 Run Synthetic Monitoring Tests
        env:
          TARGET_URL: ${{ secrets.MONITORING_TARGET_URL }}
          ALERT_SMTP_HOST: ${{ secrets.ALERT_SMTP_HOST }}
          ALERT_SMTP_USER: ${{ secrets.ALERT_SMTP_USER }}
          ALERT_SMTP_PASS: ${{ secrets.ALERT_SMTP_PASS }}
          SLACK_WEBHOOK_URL: ${{ secrets.SLACK_WEBHOOK_URL }}
        run: npx playwright test tests/monitoring/ --reporter=list

      - name: 📸 Upload Failure Screenshots & Traces
        if: failure()
        uses: actions/upload-artifact@v4
        with:
          name: failure-evidence-reports
          path: |
            test-results/
            playwright-report/
          retention-days: 7
10. Security Governance, Zero-Trust Secrets & OIDC
Because monitoring pipelines execute live transactions and interface with notification services, the architecture must adhere to strict security best practices:
Encrypted Repository Secrets
Passwords, webhooks, and API keys are stored strictly in encrypted GitHub Secrets and never committed as plain text into code.
OIDC (OpenID Connect) Token Exchange
Avoid static long-lived credentials: Use GitHub OIDC to generate short-lived, cryptographic auth tokens for Cloudflare or AWS services.
Isolated Container Sandboxes
Each workflow run boots inside a fresh, ephemeral virtual container with zero data persistence. Temporary files are destroyed upon completion.
WAF & Rate-Limiting Whitelisting
Configure firewalls to recognize dedicated synthetic test headers (e.g., X-Pragma-Synthetic-Token) to prevent accidental IP throttling.
11. Enterprise Best Practices for Flake-Free Test Suites
To ensure your serverless monitoring pipeline runs reliably without generating false alarms, follow these five core engineering principles:
1. Target Accessible Roles Rather Than Fragile CSS
Avoid fragile class selectors like .btn-submit-v2. Instead, leverage accessible role selectors such as page.getByRole('button', { name: 'Submit' }) or dedicated data-testid attributes that survive visual redesigns.
2. Dynamic Timeouts & Retry Strategies
Set short network timeouts (5–10 seconds) for uptime checks and configure Playwright with retries: 1 in CI. A transient network hiccup won't trigger false alerts—only repeated failures notify the engineering team.
3. Trace Viewers & Video Recordings
Enable Playwright trace recording on failure (trace: 'retain-on-failure'). Using trace.playwright.dev, inspect the exact failure step frame-by-frame alongside DOM snapshots and network waterfall diagrams.
4. Git-Based Performance History
Commit compressed JSON performance telemetry into a dedicated metrics branch or repo at the end of each run. This provides a free, perpetual performance logbook over months and years without third-party databases.
5. Multi-Channel Alerting with IONOS SMTP & Webhooks
Send failure dispatches simultaneously as rich HTML emails and instant markdown messages directly to your Slack, Discord, or Teams incident channels—linking directly to failure screenshots in the GitHub Run.
12. 5-Stage Rollout Roadmap for Your Monitoring Platform
Implementing a serverless synthetic monitoring platform is achieved efficiently across five structured phases:
-
Phase 1: Identify Business-Critical User Journeys
Map the most critical conversion flows on your website: contact forms, newsletter signups, user authentication, search filters, and checkout funnels.
-
Phase 2: Develop & Harden Playwright Test Suites Locally
Write modular TypeScript test scripts using resilient role selectors, cookie dismissals, and explicit DOM assertions. Verify scripts locally in headless mode.
-
Phase 3: Configure GitHub Actions YAML Pipelines with Caching
Create workflow files under
.github/workflows/, bind cron schedules, and configure binary caching to optimize execution speeds. -
Phase 4: Store Encrypted Secrets & Connect Alert Channels
Add SMTP credentials and webhook URLs to GitHub Repository Secrets and test alert delivery by triggering simulated test failures.
-
Phase 5: Integrate Performance Budgets & AI Bot Checks
Expand the pipeline with Lighthouse Core Web Vitals audits and automated validation checks for
llms.txtand Schema.org structures.
13. Conclusion: Data Sovereignty & Cost Advantage Through Code
Serverless website monitoring with GitHub Actions and Playwright provides the modern, cost-effective standard for securing web applications. By adopting "Monitoring-as-Code", organizations achieve full ownership over their test suites, eliminate silent failures, and completely remove costly SaaS subscriptions.
For digital businesses and agencies, this architecture provides an unmatched operational edge: enterprise-grade reliability, zero hosting overhead, and verified accessibility for both human users and next-generation AI search engines.
Quick Check: Deploy Serverless Monitoring
Ready to transition your website monitoring to GitHub Actions?
Schedule a Free Strategy ConsultationHave a vision?
Let's check together how we can make your idea take flight.
Book your free strategy call nowExtended Specialized Glossary
GitHub Actions
A CI/CD and automation tool by GitHub that allows developers to run builds, tests, and serverless website monitoring workflows directly in their repository.
Playwright
A modern open-source framework by Microsoft for automated E2E testing in browsers like Chromium, Firefox, and WebKit, widely used for robust website monitoring.
E2E-Testing
End-to-End testing is a validation methodology where the complete flow of an application (e.g., user login or form submission) is tested in a real browser environment from the user's perspective.
Headless Browser
A web browser (such as Chrome or Firefox) operating without a graphical user interface, controlled programmatically for automated testing and cloud-based website monitoring.
Synthetic Monitoring
An automated monitoring technique where scripts simulate real user interactions and API transactions at scheduled intervals to proactively test availability, latency, and business logic.
Continuous Integration (CI/CD)
A DevOps practice where code updates are automatically built, tested, and deployed to detect bugs early and maintain continuous software reliability.
Performance Budget
A defined constraint on technical performance metrics such as page load speed, bundle sizes, or Core Web Vitals (LCP, INP, CLS) that triggers build failures if exceeded in CI/CD pipelines.
Core Web Vitals
A set of three user experience metrics (LCP, INP, CLS) used by Google to evaluate page performance and ranking signals.