From invisible to within sight of page 1 —
no relaunch, no ad budget.
EsenTrans is a moving company in Würzburg, Germany. Its website ran on WordPress, worked fine technically — and was practically invisible on Google. One targeted technical change later, organic clicks had more than doubled. Every figure here comes straight from Google Search Console.

 Location · radius · visibility
Weekly averages before and after the change · Source: Google Search Console API, finalised data
A website that works — and nobody finds.
The site was not broken. It loaded, it was maintained, the content was accurate. There were even more than 170 city landing pages, one per location served. Even so: an average position of 19.3 and roughly 60 organic clicks per week.
What was missing was not content but context. To Google these were 170 separate pages with no discernible relationship and no machine-readable statement of which business offers which service in which area.
In practice, position 19 means the second results page. For a local service business whose customers arrive almost exclusively via Google search, that is critical — and it is the normal state of many mid-market websites.
A plugin instead of a project.
End of December 2025, a single change to the existing website. No new design, no content push, no ad budget — the plugin automatically adds what was missing on each of the 170 city pages.
Structured data per city
A MovingCompany node with address, geo coordinates, opening hours and the area actually served — city plus postal codes. Plus BreadcrumbList and FAQPage. Google no longer has to guess who offers what, where.
Automatic city interlinking
Place names in lists become links to the matching city page. Existing links are left untouched, self-links are prevented. 170 individual pages become a network — without anyone linking 170 pages by hand.
Regional block
Every city page shows "more cities in this region". This distributes link equity along geography instead of across the whole set — matching what someone looks for next after a moving quote.
Keyword linking
The first mention of a configured term links to the relevant service page — once per page, without overwriting existing links. Link equity ends up where the service is actually sold.
Structured data on every city page
- The business as an entity: address, phone, opening hours, geo coordinates — plus areaServed from city and postal codes.
MovingCompany - Makes the hierarchy home → cities → location machine-readable instead of merely implying it visually.
BreadcrumbList - The city page's questions and answers machine-readable — the basis for rich results and AI citations.
FAQPage
The areaServed is generated from the postal codes stored per city — it therefore cannot diverge from what the page states.
The core is open source
The plugin was stripped of client data and published as "Local SEO City Pages" — configurable for any local industry, from trades to medical practices. Anyone wanting to check what actually happened here can read the code instead of taking our word for it.
Why no relaunch
A relaunch would have taken months, multiplied the budget and risked the existing rankings — every URL change is a bet. The existing site was fine in terms of content; the only broken part was what machines could read from it.
This is the cheapest kind of SEO work, because it replaces nothing that already works. It is also the kind that shows up fastest: the jump in the chart below starts within days of installation.
The jump is there in the raw data.
Daily clicks and impressions, straight from the Search Console API — not redrawn, not smoothed.
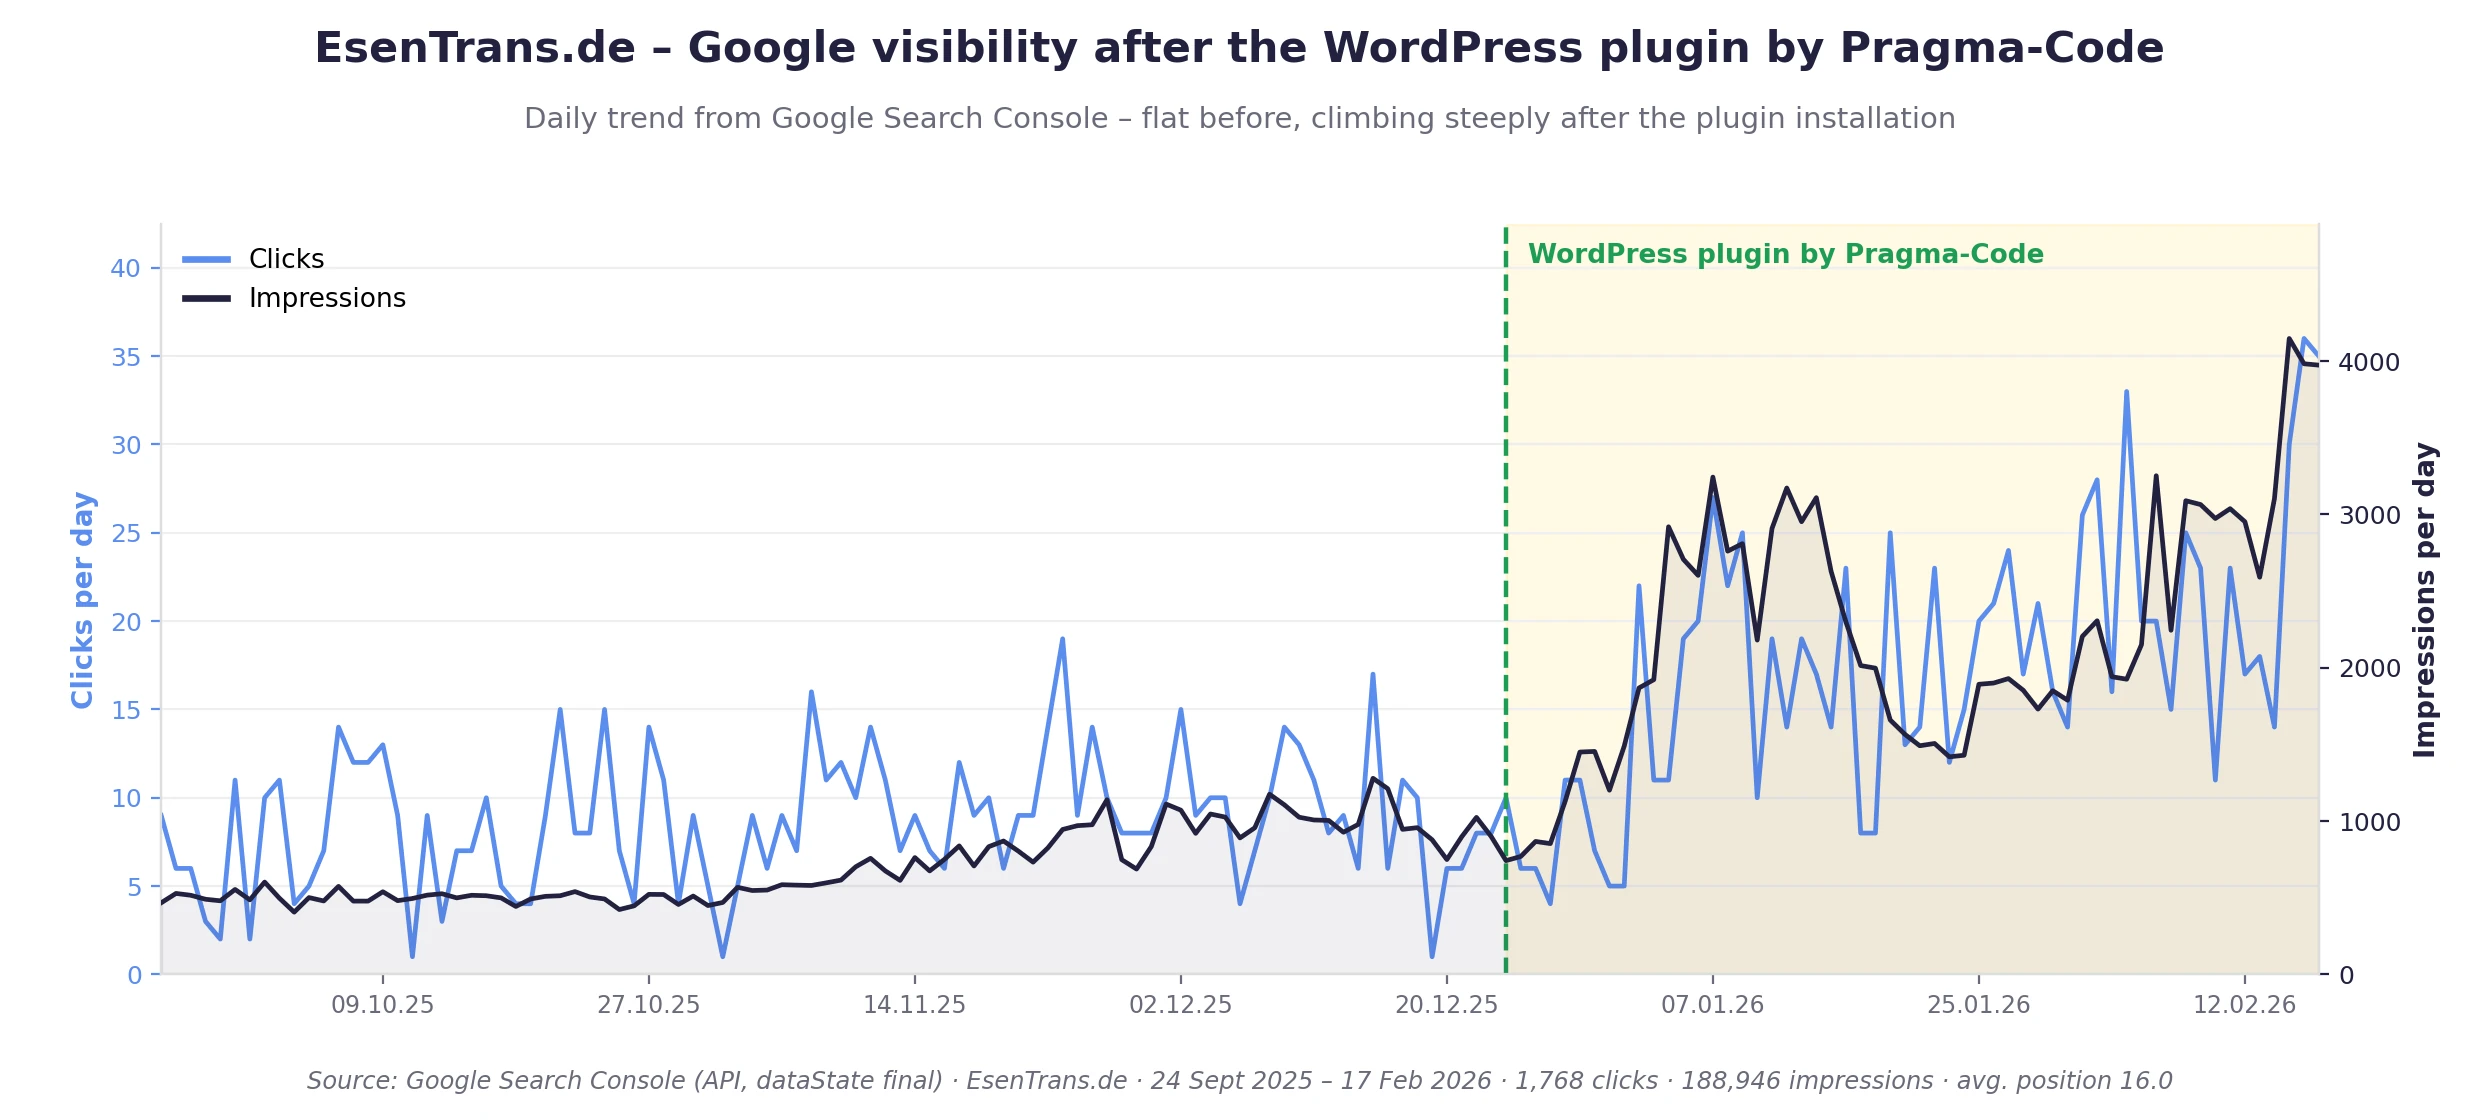
| Period | Clicks / week | Impressions / week | Avg. position |
|---|---|---|---|
| Before24 Sept – 28 Dec 2025 | 60 | ~4,980 | 19.3 |
| After29 Dec 2025 – 17 Feb 2026 | 129 | ~16,560 | 14.1 |
| Currentlast 90 days, to 11 June 2026 | 103 | ~11,030 | 11.2 |
Full period 24 Sept 2025 – 17 Feb 2026: 1,768 clicks, 188,946 impressions, average position 16.0.
The effect was not a flash in the pan.
The most interesting part is not the "after" row but the "current" row.
Lower number = better placement.
Average position kept improving after the change — today it is better than immediately after installation. Weekly clicks and impressions now sit below the initial spike. That is expected: the first jump always carries a novelty component, and the moving industry is seasonal. Position, by contrast, is the structural figure.
Where these figures come from.
The source
Every figure on this page was pulled directly from Google Search Console — via the API, using finalised data (dataState: final), for the periods stated. No extrapolation, no estimates, no modelling.
The chart shows real daily values too. An earlier version had reconstructed the daily curve and merely scaled it to the real totals — we replaced it, because "reconstructed" and "source: Search Console" do not belong together.
What deliberately appears nowhere here
This page contains no figures on enquiries, jobs won, conversion rate or revenue. Not because there were none, but because we hold no reliable measurements for them. Visibility is measurable and is shown here; anything beyond it would be guesswork.
We only publish figures we can substantiate — even when a prettier number would read better.
Is your website invisible too?
In a first call we look at your Search Console data together and find the biggest lever. Free, and it does not have to turn into a project.