
The entire inference stack determines whether an internal assistant stays responsive when a team starts using it. Here is how to test the engine, model and hardware with the same requests.
This article is an in-depth expert contribution from our content cluster. Discover the complete overview on our main page: AI & Automation →
Which inference engine fits your SME?
The prototype answers a question quickly on a Mac Studio. Then several teammates submit long document queries at the same time. The server has to process the new prompts, keep existing responses moving and decide when to admit more requests. The resulting wait is easy to miss in a single-user test. Treat the developer workstation and the shared service as separate deployment scenarios when deciding which inference engine to use.
Ollama is a straightforward starting point for a local pilot. llama.cpp is worth testing when you need direct control over the model artefact, backend and offload settings. Include vLLM when evaluating a shared CUDA endpoint. Whether any of these configurations will work depends on your actual prompt lengths, traffic patterns and quality requirements. An assistant handling brief support questions and an application retrieving long passages from technical manuals can impose very different loads even when they call the same model.
What matters for the decision
- Time to first response. Measure Time to First Token (TTFT) from the client so the result includes time spent in the gateway and engine queues.
- Team capacity. Read output tokens per second alongside the error rate and an agreed latency objective.
- Memory headroom. Budget for the longest contexts resident at the same time, including generated tokens, and for normal operations.
AI Context 2026 – Local AI sovereignty and inference costs
The vLLM v0.34.0 release notes document an extensible KV cache enabled by default on CUDA and ROCm. Cache sizing takes account of free memory after warm-up. The Ollama release notes list v0.40.16 as stable and show the v0.40.17-rc4 tag under the v0.40.17 prerelease, with concurrent request handling on Apple silicon announced. llama.cpp b12590 is marked as a prerelease and lists macOS builds. Treat vLLM Metal as a separate plugin configuration and pin the plugin version, model and feature set for the run. These release notes inform the test setup and document the features to verify.
For cost comparisons, divide the hardware share, electricity and operating costs by successfully served requests over the same period. Measure energy at the device, including idle time and model changes, and account for maintenance. To evaluate digital sovereignty for SMEs, trace prompts, documents, responses and logs. Include connections used for model downloads, updates and telemetry in the review of where data can go.
Local LLM inference engine benchmark for vLLM, Ollama and llama.cpp
This warm-start reference scenario compares vLLM, Ollama and llama.cpp on an NVIDIA GeForce RTX 4090 with 24 GB of VRAM, running Linux with CUDA 12.4. All three configurations use Meta Llama 3.1 8B Instruct with a 4,096-token context limit. vLLM uses 4-bit AWQ, while Ollama and llama.cpp use GGUF Q4_K_M.
The figures are based on measurements supplied to the editorial team for this setup. Raw logs, engine versions and specific SLO thresholds are unavailable for independent verification.
Set up comparable tests
Run a separate Linux/CUDA series on each NVIDIA card. On macOS, record the chip, unified memory capacity, system version and backend. Also record the driver, engine release and commit, launch settings, GPU clocks, temperature and utilisation. Give the load generator enough headroom to maintain the requested arrival pattern. Place it at the same point in the network for each comparison and hold the protocol and connection reuse policy constant.
Separate test series for Llama 3.1 and DeepSeek
Start with Meta’s Llama 3.1 8B Instruct checkpoint from the Llama 3 family. Pin the revision and artefact SHA-256, tokenizer, chat template, context budget, output cap, sampling settings and stop rules. Use a test request to verify that the same prompt arrives as the same sequence of input tokens. Model names in two catalogues may represent different weights, templates or defaults. For a controlled run, use the same weight artefact and KV data type wherever the stack supports them. If a shared format is unavailable, report the subset that can be compared or explicitly compare complete production configurations, including their quantization choices.
Run DeepSeek-R1-Distill-Llama-8B in a separate series. DeepSeek-AI publishes distilled and full R1 checkpoints separately. When a reasoning model exposes distinct reasoning and response channels, record the first generated content and the first visible answer separately. Specify which tokens count toward throughput. For short chats and longer local enterprise RAG prompts, prepare synthetic documents from a versioned corpus. Include tasks with known supporting passages so you can check whether the returned answers remain grounded in the documents.
Warm starts, cold starts and load profiles
Start with warm single requests. Let model loading and initialisation finish before measuring, and record cold starts separately. Use distinct prefixes in the baseline and test shared prefixes in their own series. One, two, four and eight open streams are useful proposed lab stages where the configuration supports them. Add open-loop arrivals at repeatable rates. A client that waits for one request to finish before sending another can conceal queue growth during a traffic surge.
Plan at least three independent measurement windows per stage after warm-up. Publish the sample size, percentile method, duration, warm-up and aborted requests. On a monotonic clock, timestamp dispatch and the first generated token. Ignore empty chunks, role events and metadata in SSE or JSONL adapters. If your client can observe only the first generated text fragment, report a TTFT proxy. Count output with verified usage counters or an agreed reference tokenizer and explain any known differences between the counts.
Record the observed arrival rate for each window as well. If the client falls behind the schedule because of its own limits, a low p95 tells you little about the server. During a burst, check whether closing a connection cancels generation on the server. A request that continues after its client has disconnected still consumes computation and context memory.
vLLM throughput for SMEs under load
For SMEs running a shared assistant, vLLM delivers the highest aggregate throughput in this scenario and uses the most GPU memory. llama.cpp sits between the other two on both metrics. Ollama uses the least memory and serves requests serially in this configuration. Include per-request queue time and GPU headroom for other services when planning capacity.
A service-level objective (SLO) defines the levels of latency and errors a team will accept. Count every offered request in the success-rate denominator, including timeouts, aborted streams and out-of-memory failures. Goodput here means the number of requests per second that meet the stated objective. Total output tokens per second describe the amount of work the service performed. Check end-to-end response time and the gaps between streamed fragments as well. A GPU can keep producing tokens at a high aggregate rate while short questions wait behind long inputs.
vllm bench serve and the llama.cpp Server Benchmark are useful cross-checks within their respective stacks. The Generate API exposes counts and timings for an internal decode diagnostic, eval_count / eval_duration × 10⁹, because the duration is reported in nanoseconds. llama-bench can measure prompt processing and token generation separately. Base the three-way endpoint comparison on a common client protocol. For each result, save the hardware ID, data revision, artefact and pipeline settings alongside the raw measurements. This lets the team rerun a test when an engine changes its defaults.
Set a minimum answer-quality standard before testing and decide which responses qualify for acceptance. In a document assistant, a well-formed answer can be useless if it cites a passage from the wrong manual. Review those failure modes alongside runtime metrics. A stream that met its latency objective still needs to pass the task-level quality check.
How local inference engines serve requests
A local assistant spans several layers. The application assembles the prompt, the gateway accepts the request, and the engine manages live sequences and generates tokens. The model server processes the input context during prefill and generates subsequent tokens during decode. Input length and the output budget therefore affect different parts of the same request. The diagram shows the components involved in these phases and where the platform supplies the memory they use.
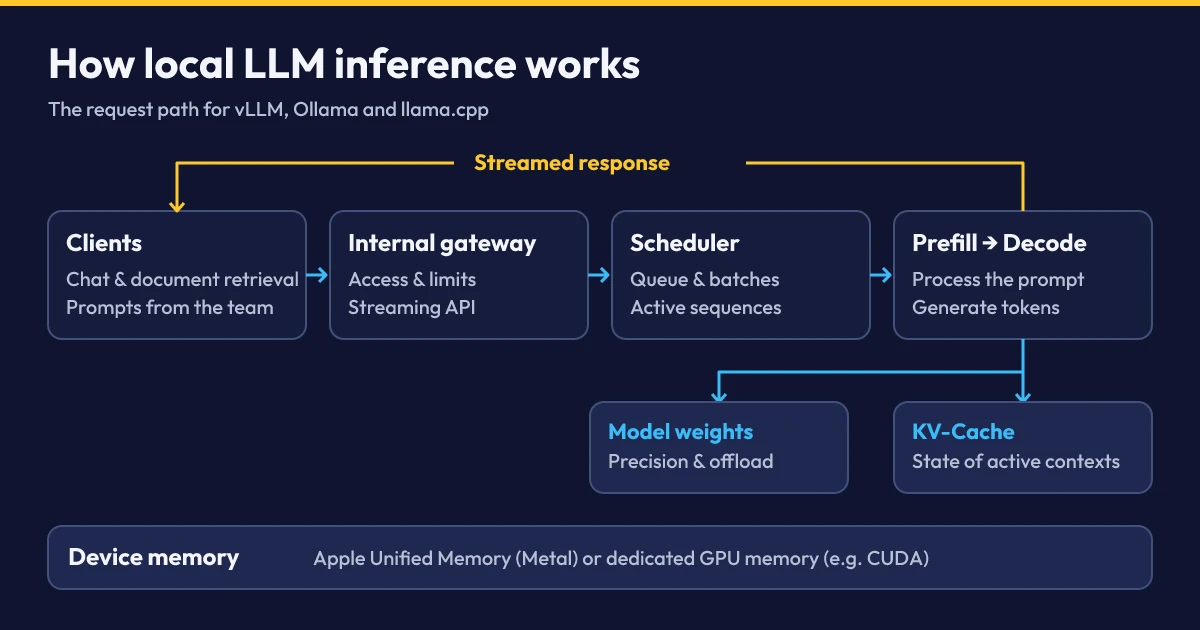
Four layers of an inference architecture
Ingestion and API
An internal gateway checks identity, limits payload size and concurrent work per client, and propagates cancellation signals. A common API style simplifies integration and measurement. Check chat templates, usage fields, error semantics and tool calls for each engine. If a proxy buffers chunks, users experience that delay as part of the stream. Apply document permissions during retrieval, so the model receives only approved excerpts and the context it needs to answer the question.
Continuous batching and PagedAttention
Continuous batching determines which requests share a computation step. Finished sequences free up capacity and newly admitted sequences can take part in subsequent steps. PagedAttention manages the keys and values used by attention in blocks. Kwon and colleagues describe how this can reduce fragmentation in their PagedAttention paper. The llama.cpp server documentation documents parallel slots and continuous batching. In Ollama, actual concurrency depends on the runner, configuration and available memory. Measure where the service starts to queue requests and when it rejects them.
llama.cpp, GGUF and VRAM
GGUF is a container for weights and metadata that supports multiple representations. The KV cache holds the keys and values reused by attention. Its data type is a separate setting. For standard MHA or GQA, calculate the payload from resident tokens and track block rounding and shared prefixes separately. When a pool is reserved, include it once in the device budget. Offloading frees space on the device and consumes host memory. Measure its effect on bandwidth and time to first response.
Multi-GPU and cluster scaling
Tensor parallelism splits tensor operations within layers. Pipeline parallelism distributes layers across devices. Both can accommodate a model whose memory requirements exceed a single card. Replicas keep independent model copies and can serve separate requests. Choose based on model size, workload and topology. Record how cards are connected and budget memory per device because layers, KV heads and temporary buffers can be distributed unevenly. The vLLM scaling documentation describes the available configurations.
Pro tip – Choosing GGUF, AWQ or GPTQ
Start with GGUF when you need Metal or deliberate CPU/GPU offload and the chosen model is supported. On vLLM with CUDA, consider AWQ or GPTQ when the kernel, GPU and checkpoint are compatible. Consult the vLLM quantization matrix and separate vLLM GGUF documentation for the version you plan to run. Use the same approved task set to review citations, structured output and factual accuracy. When the weight representation changes, evaluate the quality results alongside performance. A faster configuration can lose its advantage if its output requires more manual correction.
Review the model licence as part of artefact approval and record who performed a conversion. Store the templates and conversion parameters with the test run. At the next update, that record helps distinguish a model change from the effects of a new kernel or cache data type.
From developer testing to on-premises serving
During a pilot, the application may run on the same machine as the model. A shared service also needs network access, permissions, monitoring and a way to recover after failure. Including those paths in the pilot makes the results easier to compare with the measurements you will collect in production.
Solo testing and production serving compared
Developer testing and single requests
Keep a fixed prompt set, the model hash and runner settings on the Mac Studio. Recheck initial response time, streaming and task quality after switching models. Include longer prompts so a fast result on a short chat cannot conceal a bottleneck in the document workflow.
Production servers and concurrent requests
Set a queue limit, a timeout and an explicit overload response. Watch p95 TTFT, failure counts, active contexts and remaining capacity at the shared endpoint. Test whether latency recovers once traffic falls again. A health check should verify that the service can actually serve a model.
Choosing hardware for Mac Studio, RTX 4090 and RTX A6000
Mac Studio. On Apple’s Mac Studio, the CPU, GPU, operating system and applications draw from unified memory. Record the exact configuration, available capacity, memory pressure and swap. Treat the Metal run as its own platform profile. Compare memory results within that profile using the same counters and account for other applications active on the machine.
RTX 4090 and RTX A6000. NVIDIA specifies 24 GB for the GeForce RTX 4090 and 48 GB for the RTX A6000. Measure available capacity in GiB with the deployed driver. Llama 3.1 8B is a candidate for a pilot on either card with an appropriate quantization. Size the optional 70B run separately: at an idealised four bits per parameter, 70 billion parameters require about 32.6 GiB for weights alone. That exceeds the 4090 capacity. On the A6000, the cache, workspaces and reserve still have to fit within the measured free memory. See the Llama 3.1 Model Card from Meta for model sizes. If your budget is tight, test shorter contexts, offload or model sharding as separate configurations.
Weights [bytes] ≈ parameters × effective bits per weight / 8KV payload [bytes] ≈ resident tokens × KV layers × KV heads × head dimension × (bytes per K element + bytes per V element)
Worked VRAM example. An idealised eight billion parameters at four bits require 8,000,000,000 × 4 / 8 = 4,000,000,000 bytes ≈ 3.73 GiB for weights. In a separate example, assume 4,096 resident tokens, 32 layers, eight KV heads, head dimension 128 and two bytes each for K and V. The KV payload is 4,096 × 32 × 8 × 128 × (2 + 2) = 536,870,912 bytes = 512 MiB. These are hypothetical inputs. Divide bytes by 2³⁰ for GiB. The device budget includes resident weights, the reserved KV pool, workspaces, runtime and driver allocations, and operating headroom. Inspect actual artefacts for metadata and mixed precision. See Meta’s inference memory guide and the PagedAttention paper.
Ollama production deployment
Bind the Ollama endpoint privately and authenticate clients at the gateway. Check which runner loads the local model, how much memory concurrent contexts consume and how the queue, model switching and cancellation behave. The Local FAQ documents the relevant controls. Test a restart with an approved copy of the model and registry access disabled. For on-premises deployment in the DACH region, controlled updates and explicit ownership are part of keeping the data path local.
The state between traffic peaks matters in daily operation. A resident model changes both the next response time and idle memory usage. When other processes share the machine, test the profile with that background load. Decide which failures should trigger failover to another endpoint and which requests clients are allowed to retry. Collect only the monitoring metadata that supports those decisions. For external parties in particular, assess processing arrangements and potential international transfers under Article 28 and Chapter V of the GDPR.
From benchmark to production rollout
Define workload and data flows
Record data classes, prompt sizes, traffic peaks and latency objectives. Include prompts, documents, outputs and copies in logs or backups.
Screen models and hardware
Pin the artefacts, calculate the budget for live contexts and select representative tasks for quality assessment.
Compare endpoints under load
Measure warm, cold and overloaded conditions. Store raw data, failures and the exact server configuration together.
Secure and instrument the pilot
Require authentication, segment the network and restrict external connections. Redact logs and test deletion. Check purpose, lawful basis and external parties against the GDPR.
Set acceptance and operations criteria
Accept workload and quality together. Document and exercise rollback, recovery and updates, and assign responsibility for each.
Choosing the right engine
Ollama is a straightforward route to a local pilot. llama.cpp is a candidate when you need GGUF and controlled offload. Evaluate vLLM against the same workload targets on the shared CUDA endpoint. Once concurrent document requests fill memory, the practical limits are the context lengths the service can admit and the response times it can sustain. If it misses the objective at expected load, use the timing and memory logs to decide whether to change the context budget, model or service configuration.
Hardware purchasing quick check
- Meet the latency and error budgets at expected peak load.
- Document resident weights, the KV pool, runtime allocations and free headroom.
- Assess quality on representative tasks with the planned quantization.
- Test operating effort, access control and recovery in the same pilot.
Frequently asked questions about local inference engines
What is Time to First Token (TTFT)?
Time from sending a request to receiving the first generated token.
What is continuous batching?
The scheduler can batch active generations and newly admitted requests between computation steps.
What is quantization?
A lower-precision numerical representation that can reduce weight memory and affect model quality depending on the method.
Official sources and primary documentation
- vLLM project. vLLM v0.34.0 – Extensible KV cache on CUDA and ROCm.
- Ollama. Release Notes v0.40.16 / v0.40.17-rc4 – Release notes for v0.40.16 and v0.40.17-rc4.
- ggml-org. llama.cpp b12590 – Prerelease and macOS builds.
- vLLM project. vLLM Metal – Apple plugin, models and supported features.
- Meta (2024). Llama 3.1 Model Card – Model family and prompt format.
- DeepSeek-AI. DeepSeek-R1 Model Releases – Full R1 models and distilled checkpoints.
- Kwon et al. (SOSP 2023). Efficient Memory Management for Large Language Model Serving with PagedAttention – KV blocks and the original experimental setup.
- vLLM project. vllm bench serve – Endpoint load testing.
- ggml-org. llama.cpp Server Benchmark – Benchmarking the HTTP server.
- Ollama. Generate API – Streaming and token evaluation fields.
- ggml-org. llama.cpp Server – Parallel slots, API and continuous batching.
- vLLM project. Parallelism and Scaling – Model sharding and replication.
- vLLM project. Quantization – Methods and hardware support.
- vLLM project. GGUF in vLLM – Conditions for serving GGUF models.
- ggml-org. GGUF Specification – Container, weights and metadata.
- Apple. Mac Studio Tech Specs – Unified memory and device configurations.
- NVIDIA. GeForce RTX 4090 – Manufacturer GPU memory specification.
- NVIDIA. RTX A6000 – Manufacturer GPU memory specification.
- Meta. Accelerator Management – Components of the memory budget.
- Ollama. Local FAQ – Operational settings and concurrency.
- European Union (2016). Regulation (EU) 2016/679 – Official text, particularly Articles 5, 6, 25, 28, 32 and Chapter V.
AI automation for your business?
I deliver this for small and mid-sized businesses: at a fixed price agreed upfront, working directly with the person who builds it. Process, scope and pricing are on the service page.
See service & pricing Or request a free intro callExtended Specialized Glossary
Time to First Token (TTFT)
Time from sending a request to receiving the first generated token.
Continuous Batching
The scheduler can batch active generations and newly admitted requests between computation steps.
Quantization
A lower-precision numerical representation that can reduce weight memory and affect model quality depending on the method.